-
Posted on
How to solve it (with raycasting)
In 1945, mathematician George Pólya released the book “How to solve it”. It aims at helping math teachers guide their students into solving abstract problems by asking the right questions. It has since had a large influence on math education and computer science, to the point of being mentioned by Marvin Minksy as a book that everyone should know.
In this post, I will try to see how we can use Pólya’s methodology to solve a concrete software engineering problem: rendering 3D objects (using Golang).
Understanding the problem
Before starting to solve the problem, we must make sure that we completely understand the problem. The first question to ask ourselves is What is the data?
The data is a 3D object. The object is made out of triangles. Each triangle is made out of 3 vertices (and a normal vector). Those objects are stored in .STL files. I will parse them with the hschendel/stl lib.
The second question, which is probably the most important is What is the unknown?. Or in programming terms, What should the program output?
Our program should output an image. An image is a 2D matrix of pixels, each pixel representing a color. The most common way of representing color is the RGBA model, which stands for Red, Green, Blue, and Alpha. In Golang, images can be represented using the
image.Imagedata structure from the standard library.The third question is What is the condition (linking the data to the output)?
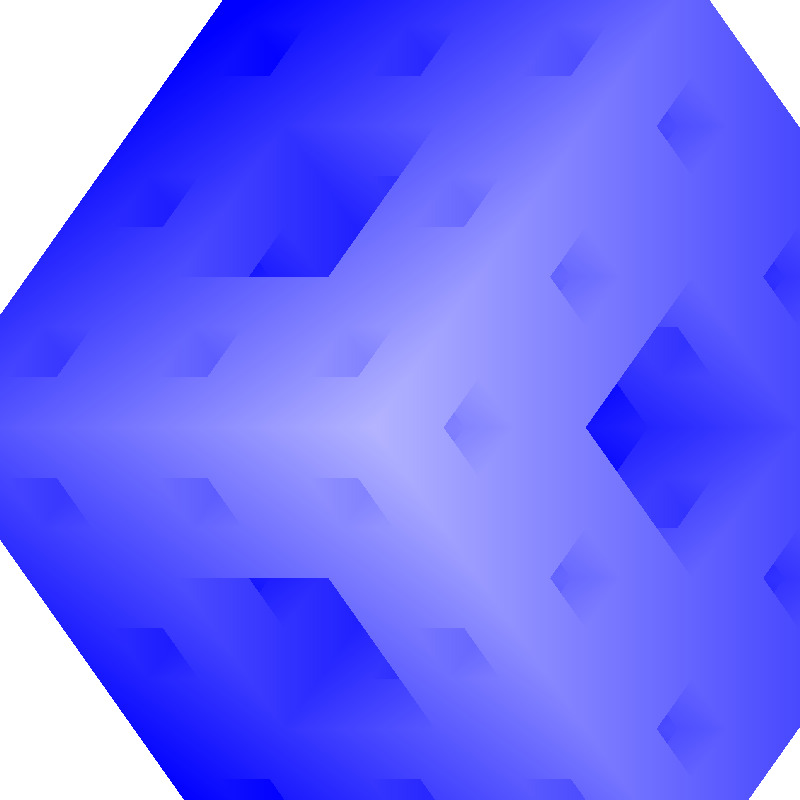
The data gives us information about the space occupied by our 3D object. If the 3D object is in front of our pixel, this pixel should be in a different color. We will use the method known as “raycasting” which consists of sending a ray from each pixel, and checking what the ray hits.
Devise a plan
Now that we have understood our problem a little bit better, we should try to plan what our solution will look like. The most helpful question to come up with a solution is Do you know a related problem?
Raycasting constists of sending a “ray” for each pixel of our image. If this ray intersects with our 3D object, the pixel needs to be updated to a different color. Since our 3D object is made entirely out of triangle, a related problem would be Does a vector intersect with a triangle?
To solve this we can implement the Möller–Trumbore intersection algorithm. This algorithm transforms the above problem into two new questions Does the ray intersect with the triangle’s plane? and if yes, Does the ray-plane intersection lie outside the triangle?
This first question is simple to solve, the only way a vector doesn’t intersect with a plane is if the vector and plane are parallel. In that case, the dot product of the ray and the triangle’s normal vector would be zero, since the dot product of two perpendicular vectors is 0 and the normal vector is itself perpendicular to the triangle’s plane.
If the ray intersects with our triangle’s plane, then we can check if the intersection is inside the plane by switching to barycentric coordinates. Barycentric coordinates are a way to represent a point in a plane in relation to the vertices of the triangle. Each corner of the triangle will get the coordinates (0,0,1), (0,1,0) and (1,0,0). Any point outside of the triangle will get coordinates outside of the range [0,1].
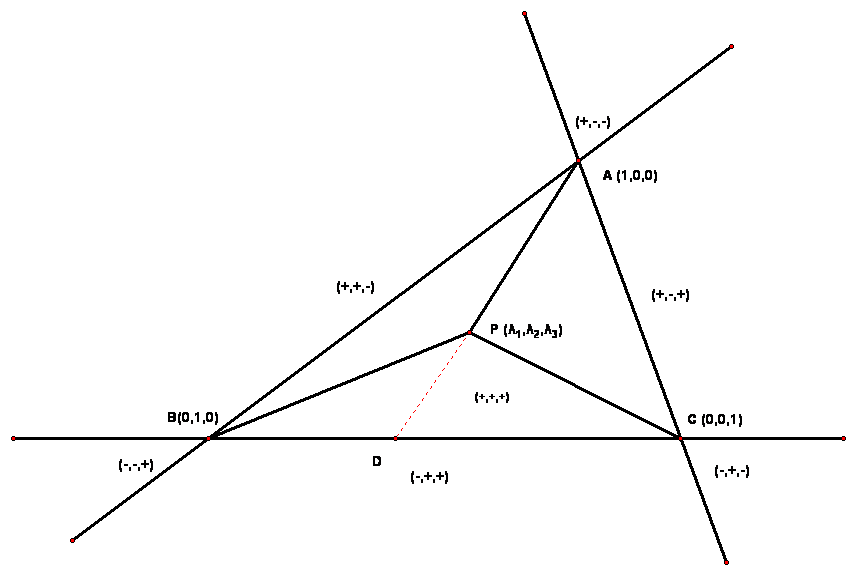
Visualizing barycentric coordinates Now that we know an algorithm that can solve our main issue, we can come up with the outline of our program:
func MTintersect(ray, triangle) bool {
	if isParallel(ray, triangle) {
		return false
	}
	u , v := projectBaryocentric(vec3, triangle)
	return u > 0 && u < 1 && v > 0 && u + v < 1
}

func main () {
	solid := readSTL()
	image := newImage(width, height)

	for i := range width {
		for j := range height {
			image.Set(i, j, white)
			ray := castRay(i, j)
			for triangle := range solid.Triangles {
				ok := MTintersect(ray, triangle)
				if ok {
					image.set(i, j, blue)
				}
			}
		}
	}

	writePNG(image)
}
Carrying out the plan
This is the easy part. We just write the code.
The main suggestion that Pólya makes, is to check that every step of the solution is correct. While programming, this can be achieved by writing unit tests to ensure the correctness of our code.
Looking back
Once we have something that seems to work it is tempting to just
git pushand call it a day. But there are a few more questions we should ask ourselves.First Can we check the result?
A good way to answer that is to test our program ourselves, either by manually going through a checklist or by writing an integration test that covers our problem.
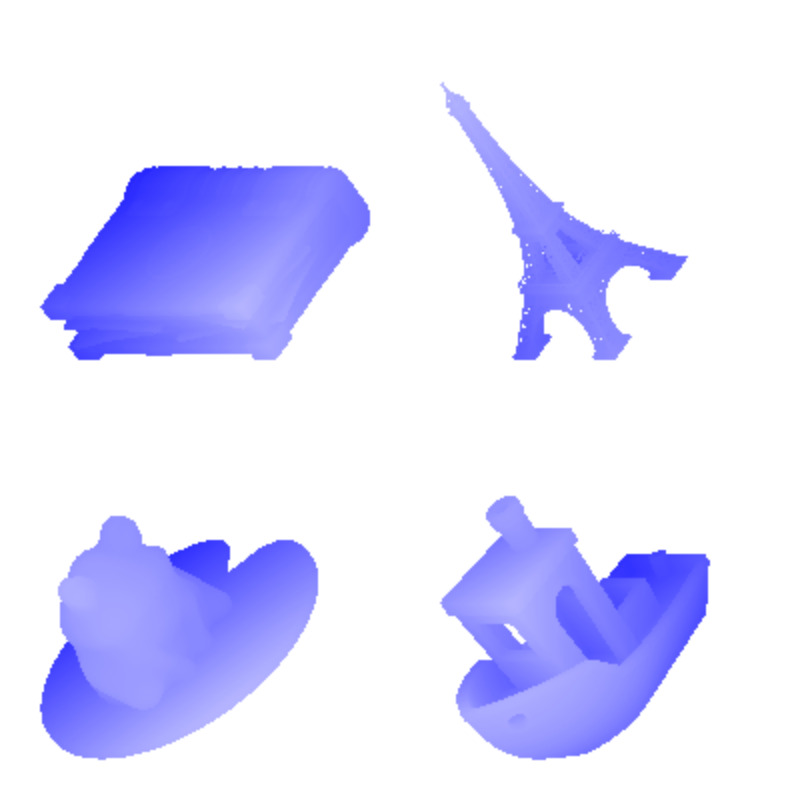
Results of rendering a few .stl files Then we should ask ourselves Can we derive the result differently?
This question is not only a good way to learn about other ways to solve our problem (like Scanline rendering in our case) but also a good opportunity to check if maybe the code we wrote was not the most intuitive solution and could be refactored.
The last question is Can you use the result for another problem?
We can answer this question by checking if our code is written in a way that is reusable enough if we ever want to. For example, the raycaster above could be used as the first step into the implementation of a more sophisticated ray tracing algorithm, if we wanted to handle reflections and lightning.
Conclusion
If you want to check the source code for the raycaster I made before writing this article, it is on my GitHub.
You can find How to solve it by Pólya in any good library.
To learn more about computer graphics check out Ray Tracing in a weekend. And for the details of the Möller-Trumbore algorithm, this video is the one that made the most sense to me.
-
Posted on
A love letter to Apache Echarts
In the world of software development, I believe the 7th circle of hell is called “NPM”. It’s a place where you can find Javascript libraries that make great promises only to disappoint you once you actually import them. I know this because I even wrote one.
When you find a gem hidden in this pile of garbage, it is important to tell the world about it. So, I am here to tell you how much I love Apache Echarts.
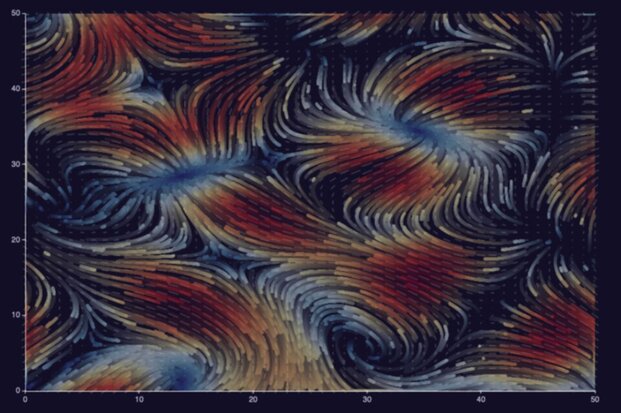
A flow visualization from the Echarts examples What is this Echarts thing about?
Apache Echarts is a data visualization library made by researchers from Zhejiang University and Baidu. It provides developers with a declarative language that helps you render charts to canvas or SVG elements.
What makes it stand out from other charting libraries is that it manages to cover a very wide range of use cases while remaining simple to use. On top of that, the documentation never failed to point me in the right direction. And most importantly, the results look good and are interactive.
A few examples
Bar chart
To get started, let’s do a simple bar chart of the stars in my GitHub repositories in 20 lines of code.
Source code
const bar = echarts.init(document.getElementById('bar'));
bar.setOption({
  legend: {},
  tooltip: {},
  dataset: {
    // dataset.source contains your data in table form
    source: [
      ['repo', 'stars'],
      ['Mikochi', 129],
      ['crud_benchmark', 40],
      ['sql-repository', 7],
    ],
  },
  xAxis: {
    // category will use the first column for the x axis
    type: 'category',
  },
  yAxis: {},
  series: [
    // this creates a bar chart
    { type: 'bar' },
  ],
});
Financial chart
If like me, you enjoy playing with financial data, you might be used to more complex charts. Echarts lets you easily combine multiple visualizations in the same canvas. The following chart uses candlesticks to visualize price fluctuations, a line for the averages, and bars for the volume.
Source code
const candles = echarts.init(document.getElementById('candles'));
candles.setOption({
  title: { text: 'Apple Inc. Week 6 2024' },
  tooltip: {},
  dataset: {
    source: [
      ['date', 'close', 'open', 'lowest', 'highest', 'volume', 'sma50'],
      ['2024-02-09', 188.85, 188.65, 188.00, 189.99, 45155216.0, 190.48],
      ['2024-02-08', 188.32, 189.38, 187.35, 189.54, 40962047.0, 190.51],
      ['2024-02-07', 189.41, 190.64, 188.61, 191.05, 53438961.0, 190.54],
      ['2024-02-06', 189.30, 186.86, 186.77, 189.31, 43490762.0, 190.55],
      ['2024-02-05', 187.68, 188.15, 185.84, 189.25, 69668812.0, 190.59],
    ],
  },
  xAxis: {
    type: 'time', // automatically parses the dates
  },
  yAxis: [
    // scaled axis for the price
    { name: 'Price', scale: true },
    // hidden axis for the volume
    {
      max: 150000000,
      scale: true,
      axisLabel: { show: false },
      axisLine: { show: false },
      splitLine: { show: false },
    },
  ],
  series: [
    // this creates a candlestick chart using cols [0-5]
    {
      type: 'candlestick',
      yAxisIndex: 0,
      tooltip: {
	formatter: (param) => `
	  Date: ${param.value[0]}<br />
	  Open: ${param.value[2]}<br />
	  High: ${param.value[4]}<br />
	  Low: ${param.value[3]}<br />
	  Close: ${param.value[1]}<br />
	`,
      },
    },
    // the volume gets mapped to a bar chart
    {
      type: 'bar',
      encode: { x: 'date', y: 'volume' },
      yAxisIndex: 1,
      tooltip: {
	formatter: (param) => `Volume: ${param.value[5]}`,
      },
    },
    // SMA line
    {
      type: 'line',
      encode: { x: 'date', y: 'sma50' },
      yAxisIndex: 0,
      tooltip: {
	formatter: (param) => `SMA50: ${param.value[6]}`,
      },
    },
  ],
});
Animated line chart
One of the cool things about Echarts is that you’re not limited to creating static pictures. Charts are animated, which for example lets you create line races like this:
Source code
const makeOptionsWithRandomData = () => {
  // randomized dataset with 4 columns
  const dataset = [['x', 'y', 'y2', 'y3']];
  for (let i = 1; i < 25; i++) {
    dataset.push([i, i * Math.random(), i * Math.random(), i * Math.random()]);
  }

  return {
    // this will make the animation last 10000ms
    animationDuration: 10000,
    dataset: { source: dataset },
    xAxis: { type: 'category' },
    yAxis: {},
    series: [
      { type: 'line' },
      { type: 'line' },
      { type: 'line' },
    ],
  };
}

const race = echarts.init(document.getElementById('race'));
race.setOption(makeOptionsWithRandomData());

setInterval(() => {
  // reset the chart with new random data
  race.clear();
  race.setOption(makeOptionsWithRandomData(), true);
}, 10000);
Interactive pie chart
The charts can also be made interactive using Javascript event listeners. Click on the chart below to change it from a Pie to a Treemap.
Source code
// steam players by editor and games
const data = [
  {
    value: 1568930,
    name: 'Valve',
    path: 'Valve',
    children: [
      { value: 954936, name: 'Counter-Strike 2', path: 'Valve/Counter-Strike 2' },
      { value: 613994, name: 'Dota 2', path: 'Valve/Dota 2' },
    ],
  },
  {
    value: 434978,
    name: 'Pocketpair',
    path: 'Pocketpair',
    children: [
      { value: 434978, name: 'Palworld', path: 'Pocketpair/Palworld' },
    ],
  },
  {
    value: 286851,
    name: 'KRAFTON, Inc.',
    path: 'KRAFTON, Inc.',
    children: [
      { value: 286851, name: 'PUBG: BATTLEGROUNDS', path: 'KRAFTON, Inc./PUBG: BATTLEGROUNDS' },
    ],
  },
  {
    value: 147735,
    name: 'Electronic Arts',
    path: 'Electronic Arts',
    children: [
      { value: 147735, name: 'Apex Legends™', path: 'Electronic Arts/Apex Legends™' },
    ],
  }
];

const pieOptions = {
  tooltip: {},
  series: [
    {
      type: 'pie',
      universalTransition: true, // smooth transition between chart types
      data, // treelike data can't be passed to dataset.source
    },
  ]
};
const treemapOptions = {
  tooltip: {},
  series: [
    {
      type: 'treemap',
      universalTransition: true,
      data,
    },
  ]
};

let isPie = true;
const map = echarts.init(document.getElementById('map'));
map.setOption(pieOptions);

map.on('click', () => {
  // switch the options
  map.setOption(isPie ? treemapOptions : pieOptions, true);
  isPie = !isPie;
});
Try it yourself
If you want to try it yourself, I suggest heading to the official tutorial. There you will find instructions about how to set up and start using Echarts, as well as how to customize it to fit into your existing design systems.
As there are many features I didn’t showcase in this article (like 3D graphs), I also recommend taking a look at the official examples.
-
Posted on
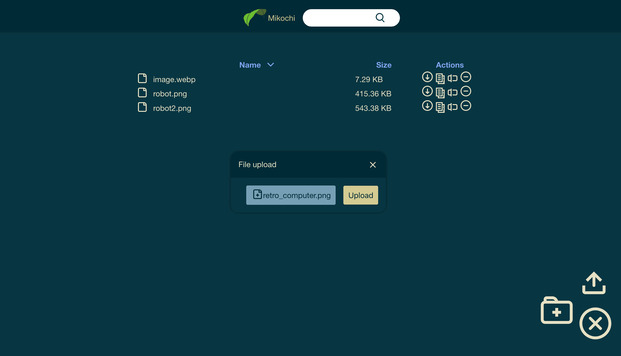
Setting up Mikochi with Docker and Traefik
Last year, I spent a little bit of time re-learning full-stack development and built Mikochi. The project has since grown to version 1.3.1 and reached 100 stars on GitHub. This article aims to be a step-by-step guide on how to install it and configure it to use HTTPS with Docker and Traefik.
Preparation
First of all you, will need a Linux server. Mikochi was tested and works well on a 512MB RAM/1 vCPU virtual machine, so I recommend getting at least that. For this tutorial, I used Ubuntu 23.10, but it should also work on other distributions.
To install Docker, follow the instructions from the official docs. Or just run:
curl https://get.docker.com | shMikochi will need access to a folder on your hard drive to store and manage your files. I suggest just creating one in your home directory named
/data:mkdir dataLaunching Mikochi
The easiest way to launch Mikochi is to use docker-compose. Let’s create a
docker-compose.ymlfile with just enough to launch Mikochi:version: '3' services: mikochi: image: zer0tonin/mikochi:latest # for ARM (Raspberry Pi), use mikochi:latest-armv7 volumes: - ./data:/data ports: - 80:8080Running
docker compose up -dshould pull the latest Mikochi image, run it, mount thedatadirectory, and listen on port 80 (the default HTTP port). You should be able to access Mikochi by going to your server’s IP in your browser. You can log in using the default username and password combination: root/pass.To change this username and password, you can set environment variables on the mikochi container in your docker-compose.yml. For example:
    environment:
      USERNAME: alice
      PASSWORD: correcthorsebatterystaple
If you want to access Mikochi using a domain name, you can also indicate it by setting up the
hostnamevalue in your service definition:hostname: your.host.nameSetting up Traefik
Traefik is a reverse proxy: it takes HTTP requests and forwards them to other applications. This can be very convenient if you have multiple services running over the same machine since the reverse proxy will take care of automatically routing each request to the right service.
For the most basic Traefik setup, we need to add a service to our docker-compose file to launch the Traefik container:
  traefik:
    image: "traefik:v2.10"
    command:
      - "--providers.docker=true"
      - "--providers.docker.exposedbydefault=false"
      - "--entrypoints.web.address=:80"
    ports:
      - "80:80"
    volumes:
      - "/var/run/docker.sock:/var/run/docker.sock:ro"
Then we need to modify the
mikochiservice indocker-compose.ymlto remove the hostname and ports blocks, and replace them with labels used by Traefik:mikochi: image: zer0tonin/mikochi:latest environment: USERNAME: alice PASSWORD: correcthorsebatterystaple volumes: - ./data:/data labels: - "traefik.enable=true" - "traefik.http.routers.mikochi.rule=Host(`your.host.name`)" - "traefik.http.routers.mikochi.entrypoints=web"Running
docker compose up -d, should now launch both Traefik and Mikochi. Accessing your domain (or VM’s IP) with your browser should still show you the Mikochi file browser. But HTTPS is not there yet.
Hakumei & Mikochi is a great anime by the way HTTPS with Let’s Encrypt
The internet is a dangerous place, and transferring files over plain unsecured HTTP is not always a good idea. Switching to HTTPS used to be a hassle, but now you can obtain certificates for free from Let’s Encrypt, and to make things even better, we can just ask Traefik to do all the work for us.
Before going back to our docker-compose file, let’s create a
letsencryptfolder, that will be used to store certificates.mkdir letsencryptTo switch to HTTPS, first, you’ll need Traefik to listen on port 443 instead of 80. This is done by changing the flag
entrypoints.web.addressto 443 and making sure that docker-compose maps the 443 port correctly:ports: - "443:443"Next, we will need to tell Traefik to create a Certificate Resolver and call it
myresolver. This resolver will use a TLS challenge, which is in my opinion the simplest to use. Let’s Encrypt requires that give them a valid email for verification purposes. This is done by passing the following flags to traefik:- "--certificatesresolvers.myresolver.acme.tlschallenge=true" - "--certificatesresolvers.myresolver.acme.email=your@email.com" - "--certificatesresolvers.myresolver.acme.storage=/letsencrypt/acme.json"The certificate will be stored in
/letsencrypt/acme.json, so we need to mount the previously createdletsencryptdirectory:volumes: - "./letsencrypt:/letsencrypt" - "/var/run/docker.sock:/var/run/docker.sock:ro"Lastly, we will need Mikochi to use
myresolver. This is done by thetraefik.http.routers.mikochi.tls.certresolverwith the valuemyresolver.Your final
docker-compose.ymlfile should look like this:version: '3' services: traefik: image: "traefik:v2.10" command: - "--providers.docker=true" - "--providers.docker.exposedbydefault=false" - "--entrypoints.web.address=:443" - "--certificatesresolvers.myresolver.acme.tlschallenge=true" - "--certificatesresolvers.myresolver.acme.email=your@email.com" - "--certificatesresolvers.myresolver.acme.storage=/letsencrypt/acme.json" ports: - "443:443" volumes: - "./letsencrypt:/letsencrypt" - "/var/run/docker.sock:/var/run/docker.sock:ro" mikochi: image: zer0tonin/mikochi:latest environment: USERNAME: alice PASSWORD: correcthorsebatterystaple volumes: - ./data:/data labels: - "traefik.enable=true" - "traefik.http.routers.mikochi.rule=Host(`your.host.name`)" - "traefik.http.routers.mikochi.entrypoints=web" - "traefik.http.routers.mikochi.tls.certresolver=myresolver"Run
docker compose up -dto start both containers, wait a couple of minutes for the certificates to appear, and enjoy using Mikochi with HTTPS. -
Posted on
Detecting offensive words with Mistral AI 7B
When working on a simple one-time passphrase generator, I stumbled upon the issue of offensive words coming up in the output displayed to users. To solve this problem, I needed a way to detect and filter them out automatically.

A robot censoring books (by Stable Diffusion) Do you really need an LLM for that?
The problem of filtering out offensive words isn’t exactly new. A simple way of solving it would be to use a blacklist of offensive words. There are already quite a few people who did that around the internet. Sadly building an exhaustive list of offensive words is harder than it seems. In most cases, it took me less than a minute to find insults that bypassed those blacklists.
There are also statistical models like profanity-check, which does not use blacklists and should filter a much larger amount of words. But, from my tests, it also does not take very long before you can find words that go through the check but shouldn’t. I think these models may be performing better on whole sentences than single words.
On the other hand, LLMs were trained over an insanely huge text corpus. While I remain skeptical of the claims that LLMs will take over the world, it seems pretty evident that they are excellent tools for natural language processing and should be able to detect offensive words.
Introducing Mistral-7B-Instruct-v0.1
While everyone seems to be using GPT-4, I chose to not follow the wisdom of the crowd and check out Mistral 7B. Since those guys raised a 105m€ seed round, it has to be at least decent. The main selling point compared to GPT-4, is that it is open-source, which guarantees that the model should remain usable even if the company behind it goes under.
I quickly gave up on trying to run it on my laptop, but instead chose to use Cloudflare Workers AI. This service lets you set up serverless LLMs on Cloudflare’s infrastructure. This removes most of the operational complexity, for very little cost.
I decided to use the instruct version of the model. This version was finetuned to follow instructions, so it let us ask it to generate outputs in the format we want. For example, we can ask the model to only reply with “yes” or “no”, which is easy enough to parse.

Photo by Joshua Hoehne The following prompt will check if a given word is offensive or not:
const messages = [
  { role: 'system', content: 'You check if words are offensive, reply using yes or no' },
  { role: 'user', content: word },
];
From this, I built a service that takes a list of words as input and only returns the good ones. It is merely 65 lines of TypeScript, as most of the logic is handled in the LLM’s black box. It can be queried with a POST request, like this:
~ ❯ curl -X POST \
     -H "Content-Type: application/json" \
     -d '["elephant", "murder", "tulip"]' \
     http://localhost:8787

["elephant","tulip"]
Turning that into a dictionary
Cloudflare’s Workers AI is currently in beta, so the API changes all the time, the rate-limiting is not very straightforward and it sometimes throws 500 at you. Calling it directly from a production environment seems out of the question. Thankfully, the English dictionary doesn’t change too often, so we can just check everything once and build a new “clean” dictionary from that.
The dictionary took a couple of hours to generate, as I tried to stay below the imposed rate limit. It is not perfect, but it contains 355424 words (from 370105 in the source dictionary). You can see the result as well as the full code source for this article on GitHub.
-
Posted on
Atlas: Declarative schemas for SQL databases
Database migrations are often one of the most dreaded parts of working with SQL databases. In many cases, teams end up keeping a bunch of timestamped
.sqlfiles and automatically running them in order. While this work, it doesn’t scale well: the more developers you have working on your schema, the more you increase the risk of conflicts. Atlas solves this problem by offering you to define your SQL schemas in a declarative manner, without requiring you to use a specific ORM.
Image by Dariusz Sankowski Imperative vs Declarative
The traditional way of managing database schemas is through imperative changes. It consists of describing the steps required to achieve the state you want. This is consistent with the tools given to us by SQL: once you have created a table with
CREATE TABLE, you’re not supposed to re-useCREATE TABLEbut to append changes withALTER TABLE.Declarative programming works by describing the state you expect and letting your tools figure out how to get there. This is similar to what can be found in languages like Prolog or LISP, or tools like terraform. Declarative solutions are a great match for infrastructure problems because they allow you to keep track of the expected state of your systems, and let you use git for versioning and merging changes. This removes toil from the ops team while increasing visibility on the system’s state.
Getting started with Atlas
To create a table with Atlas, you just have to write a
CREATE TABLESQL statement. Like the following, which I will write in aschema.sql:CREATE TABLE `users` ( `id` int NOT NULL, `name` varchar(100) NULL, `password` char(88) NOT NULL, PRIMARY KEY (`id`) );To run this in my database, you can use
atlas schema apply, which takes the URL of your database using-u, the file path using--to, and the address of a test database (for linting) using--dev-url(you can usedocker://to have Atlas launch an ephemeral docker container).atlas schema apply \ -u "mysql://root:pass@localhost:3306/db" \ --to "file://schema.sql" \ --dev-url "docker://mysql/8/dbNow if you want to modify the table you created, you can modify the
CREATE TABLEstatement inschema.sql. For example, I turn thenamecolumns intoNOT NULL:CREATE TABLE `users` ( `id` int NOT NULL, `name` varchar(100) NOT NULL, `password` char(88) NOT NULL, PRIMARY KEY (`id`) );Rerunning the same
atlas schema applycommand will modify the database appropriately. In the output, we can see that Atlas generated the following SQL statement to achieve that:ALTER TABLE `users` MODIFY COLUMN `name` varchar(100) NOT NULL;Using HCL
Atlas also allows you to use HCL to define schemas. You might already be familiar with HCL if you have been using Terraform, but if not, the main benefit is that it is easy to read and modify for both humans and computers. This is interesting if you ever need your CI to interact with your database schemas.
The
userstable from the previous example would look like this in HCL:table "users" { schema = schema.db column "id" { null = false type = int } column "name" { null = false type = varchar(100) } column "password" { null = false type = char(88) } primary_key { columns = [column.id] } }As a bonus, HCL doesn’t require a database for linting, so if you choose to use this, you can skip the
--dev-urlparameter when applying.
Image by Michael Gaida Migrating an existing system
With an already running database, you can use
atlas schema inspectto generate the schema files. It also requires a-uparameter for the database URL and--formatfor the output format (SQL/HCL/JSON).atlas schema inspect \ -u "mysql://root:pass@localhost:3306/db" \ --format '{{ sql . }}'If you are already using an imperative migration system, and do not want to throw it away right now, you can also use Atlas to generate migration files. This is done using the
atlas migrate diff [migration_name]command, which takes a--dirparameter for the migration folder, a--toparameter for the schema file, and a--dev-urlparameter like the apply command.atlas migrate diff my_migration \ --dir "file://migrations" \ --to "file://schema.sql" \ --dev-url "docker://mysql/8/test"Use
atlas migrate applyto run the migrations:atlas migrate apply \ -u "mysql://root:pass@localhost:3306/db" \ --dir "file://migrations"Integrating Atlas to your Go codebase
After using Atlas for a bit, you might need to write a wrapper for it or want to use it as part of your custom infrastructure tooling. This is made simple with their Go SDK. The packages
ariga.io/atlas-go-sdk/atlasexecwill expose all the high-level functions that you can use for that.The example below behaves like
atlas schema apply:func main() { client, err := atlasexec.NewClient(".", "atlas") if err != nil { log.Fatalf("failed to initialize client: %v", err) } params := atlasexec.SchemaApplyParams{ URL: "mysql://root:pass@localhost:3306/db", To: "file://schema.hcl", } res, err := client.SchemaApply(context.Background(), ¶ms) if err != nil { log.Fatalf("Failed to apply schema: %v", err) } log.Printf("Applied %d changes (%d pending)\n", len(res.Changes.Applied), len(res.Changes.Pending)) }
subscribe via RSS